Streamlit is an open-source Python library designed for building interactive web applications for data science and machine learning projects.
With Streamlit, you can quickly create web apps to visualize data, share machine learning models, and interact with datasets—all using simple Python scripts.
This project is to create a website using python and streamlit weather APP example
3. Create a streamlit app to display the plot and table
a streamlit app weather_app.py to display the weather with plotly and greate table
Code
import pandas as pdimport streamlit as stfrom great_tables import GT, loc, styleimport plotly.express as pxst.set_page_config(layout="wide")# Load the data@st.cache_datadef load_data():return pd.read_csv("weather_data.csv")weather_df = load_data()# City selectioncities = weather_df["City"].unique()selected_city = st.selectbox("Select a city", cities)# Filter data for the selected citycity_df = weather_df[weather_df["City"] == selected_city].reset_index(drop=True)@st.cache_datadef convert_df_to_csv(df):# IMPORTANT: Cache the conversion to prevent computation on every rerunreturn df.to_csv(index=False).encode("utf-8")csv = convert_df_to_csv(city_df)st.download_button( label="Download Weather Data (CSV)", data=csv, file_name=f"{selected_city}_weather_data.csv", mime="text/csv",)# Display the Plotly chartst.header("Temperature Trend")fig = px.line(city_df, x="date", y=["temperature_max", "temperature_min"], labels={"value": "Temperature (°C)", "variable": "Temperature Type"}, title="Max and Min Daily Temperatures")st.plotly_chart(fig, use_container_width=True)# Display the Great Tablest.header(f"Weather Forecast for {selected_city}")gt = GT(city_df)gt = gt.tab_header( title=f"{selected_city}", subtitle=f"Weather from {pd.to_datetime(city_df['date'].min()).strftime('%B %d')} to {pd.to_datetime(city_df['date'].max()).strftime('%B %d, %Y')}")# Color AQI statusaqi_colors = {"Good": "#90EE90","Moderate": "#FFFF00","Unhealthy for Sensitive Groups": "#FFA500","Unhealthy": "#FF0000","Very Unhealthy": "#800080","Hazardous": "#808080"}for status, color in aqi_colors.items(): gt = gt.tab_style( style=style.fill(color=color), locations=loc.body( columns="us_aqi_status", rows=lambda df: df["us_aqi_status"] == status ) )gt = gt.data_color( columns=["rain_prob"], domain=[50, 100], palette=["#ffcdd2", "#f44336"], na_color="#FFFFFF00")gt = gt.fmt_number(columns=["temperature_max", "temperature_min", "pm2_5", "us_aqi"], decimals=1)gt = gt.fmt_percent(columns=["rain_prob"], scale_values=False, decimals=0)gt = gt.cols_label( date="Date", day="Day", temperature_max="Max Temp (°C)", temperature_min="Min Temp (°C)", weather="Weather", rain_prob="Rain Probability", pm2_5="PM2.5", us_aqi="US AQI", us_aqi_status="AQI Status")st.html(gt._repr_html_())
4. Run the streamlit app using github action
github action to run the streamlit app: .github/workflows/schedule-email.yml. it run every day 6:00PM Beijing time (22:00 UTC).And it will also run when a new push to the main branch.
name: Refresh weather dataon:push:branches:- mainschedule:-cron:'0 22 * * *' # 6:00 AM Beijing time is 22:00 UTCjobs:refresh-data:runs-on: ubuntu-latestpermissions:contents: writesteps:-name: Check out repositoryuses: actions/checkout@v4-name: Set up Pythonuses: actions/setup-python@v5with:python-version-file:"pyproject.toml"-name: Install uvuses: astral-sh/setup-uv@v6-name: Install the projectrun: uv sync --locked --all-extras --dev-name: Run data download scriptrun: uv run download_data.py-name: Commit and push if it changed run: |- git config user.name "Automated Publisher" git config user.email "actions@users.noreply.github.com" git add -A timestamp=$(date -u) git commit -m "Latest data: ${timestamp}" || exit 0 git push
Source Code
---title: "Weather App with Streamlit"author: "Tony D"date: "2025-07-18"categories: - AI - Pythonexecute: warning: false error: false eval: falseimage: 'https://streamlit.io/images/brand/streamlit-logo-secondary-colormark-darktext.svg'---Streamlit is an open-source Python library designed for building interactive web applications for data science and machine learning projects.With Streamlit, you can quickly create web apps to visualize data, share machine learning models, and interact with datasets—all using simple Python scripts.This project is to create a website using python and streamlit weather APP example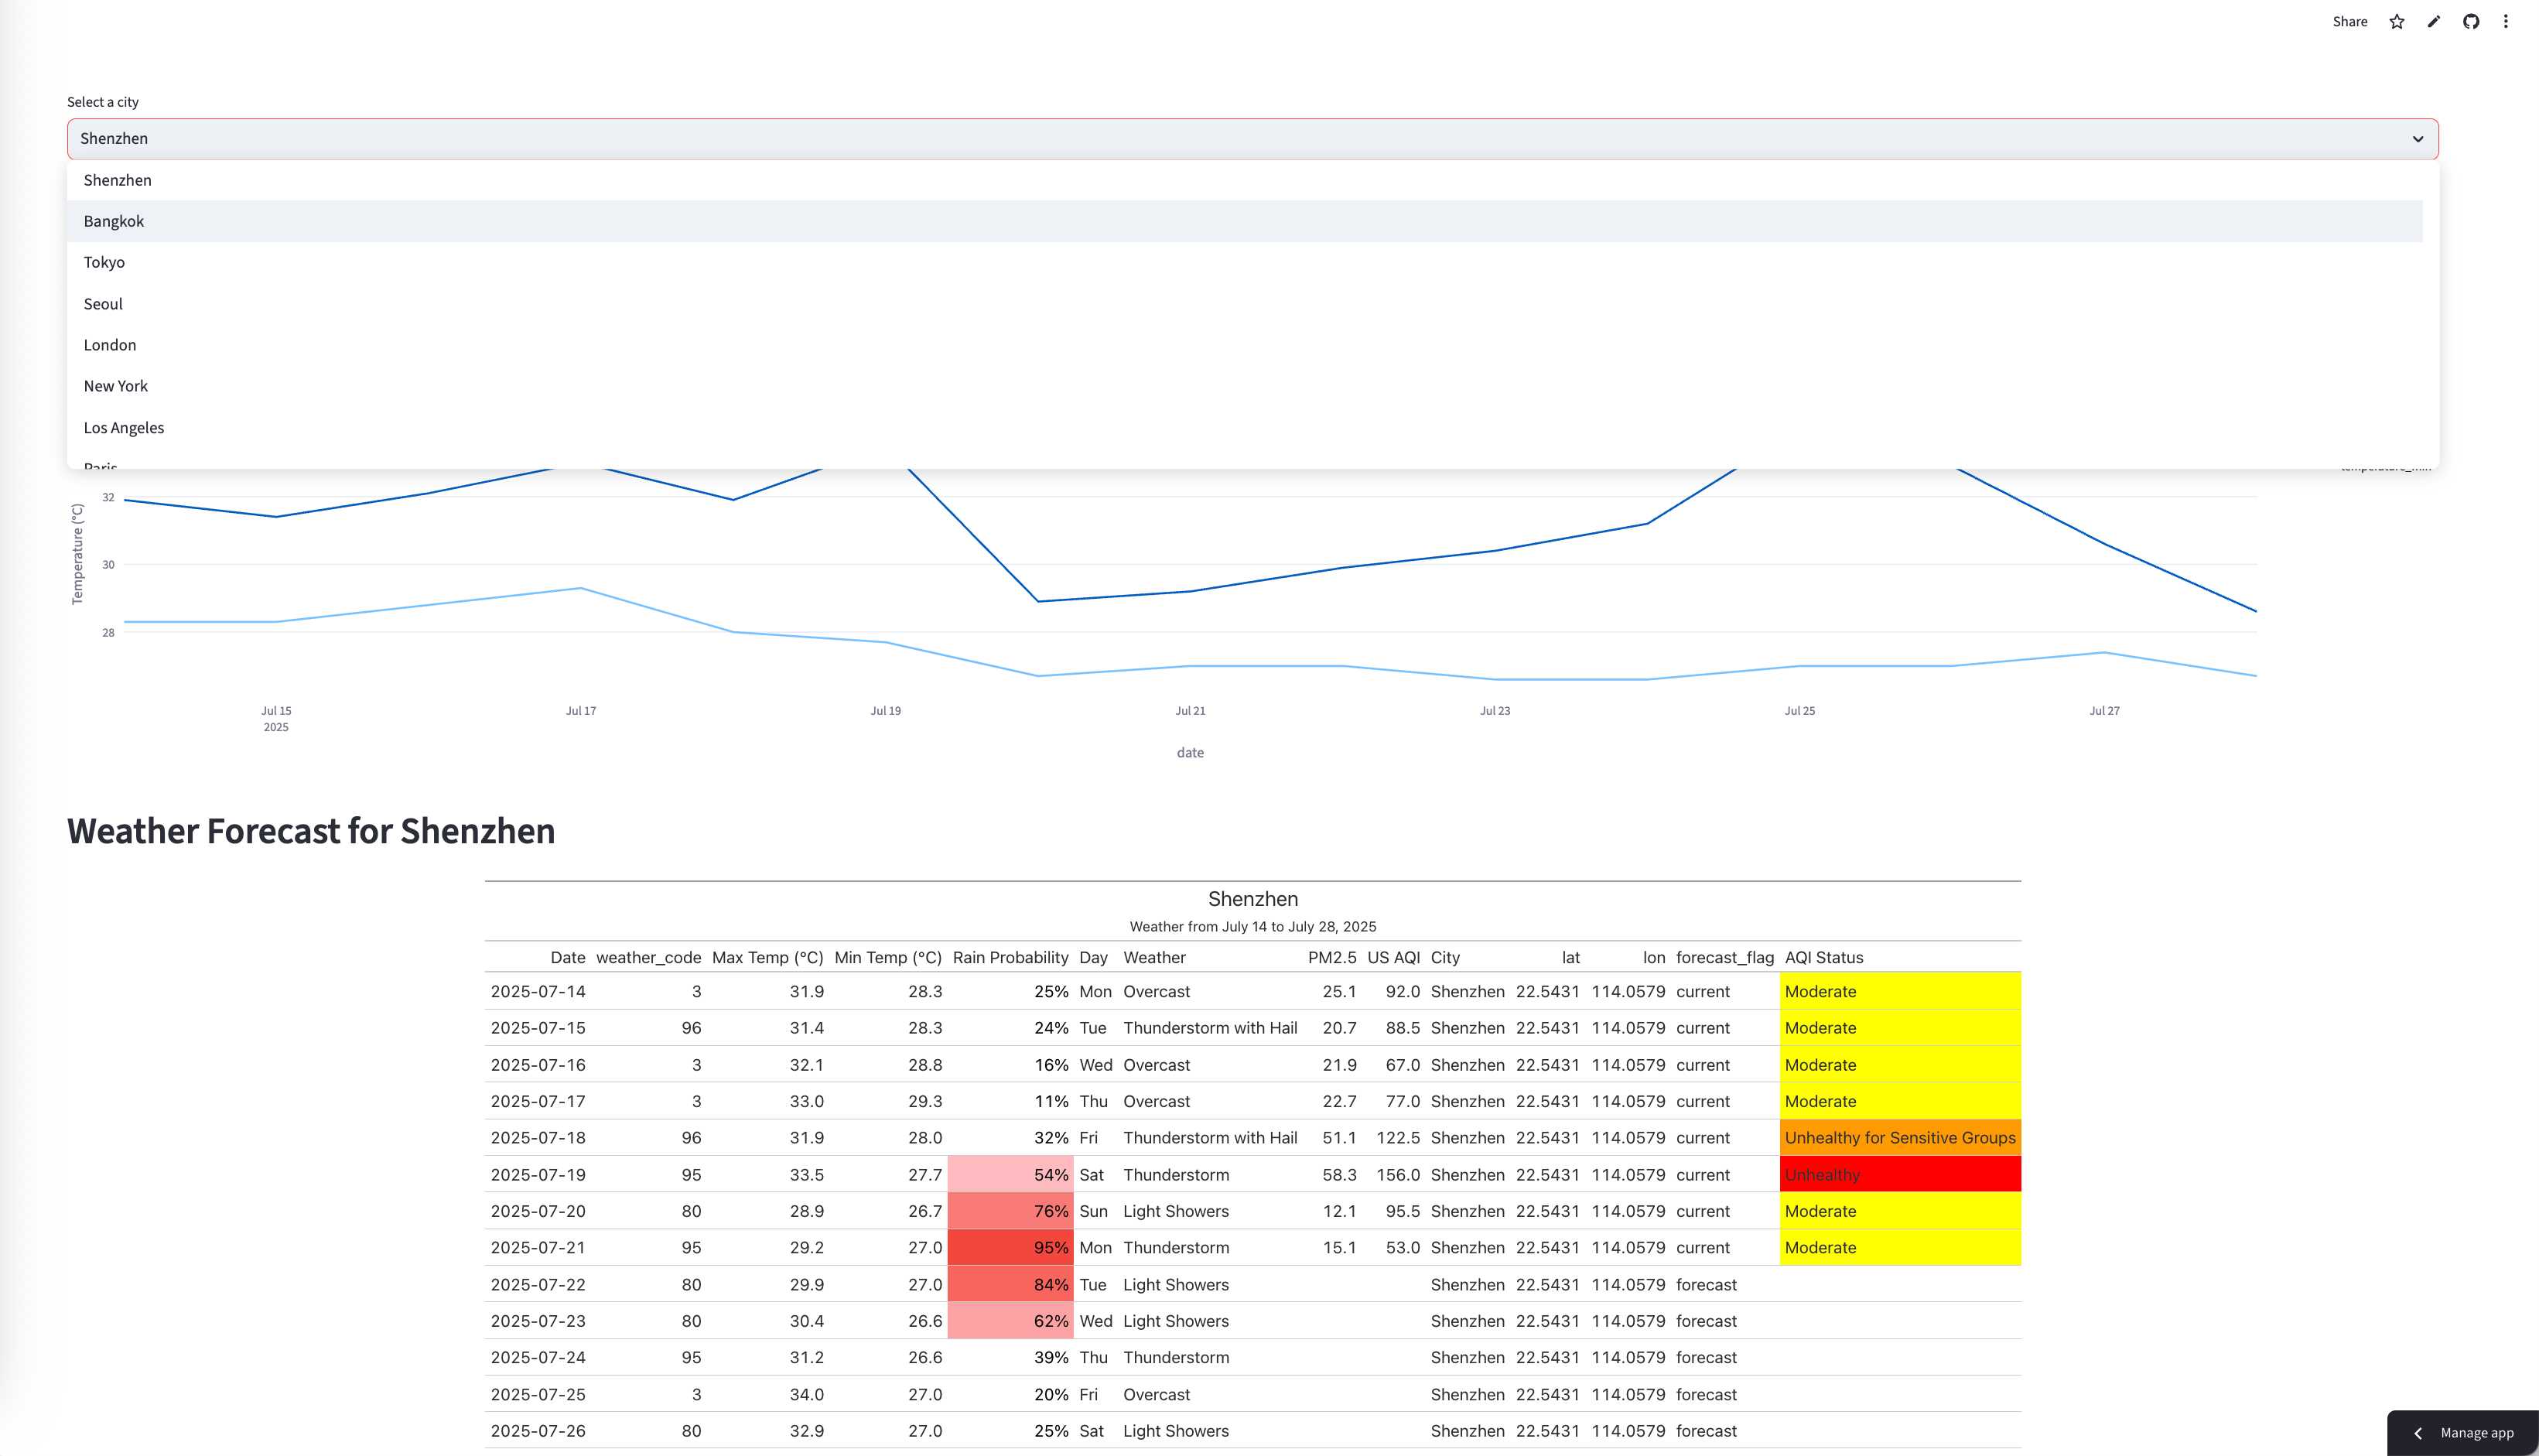[City Weather App](https://city-weather.streamlit.app/)## 1. First setup virtual environment with python version 3.13 using uv and add package``` bashuv init --python python3.13uv add streamlit pandas requests great_tables plotly```## 2. Download data from APIpython script `download_data.py` to download weather forcast data from open-meteo.com. This script will be run by a github action every day.```{python}#| echo: true#| code-fold: trueimport pandas as pdimport requestsfrom datetime import date, timedeltaimport concurrent.futuresdef generate_weather_data(city_name, lat, lon):""" Fetches weather and air quality data for a given city. """# 1. Define Date Range today = date.today() start_date = today - timedelta(days=7) end_date = today + timedelta(days=7)# 2. Fetch Weather and Rain Probability Data weather_df =Nonetry: weather_url ="https://api.open-meteo.com/v1/forecast" params = {"latitude": lat,"longitude": lon,"daily": "weather_code,temperature_2m_max,temperature_2m_min,precipitation_probability_mean","start_date": start_date.strftime("%Y-%m-%d"),"end_date": end_date.strftime("%Y-%m-%d"),"timezone": "auto" } resp_weather = requests.get(weather_url, params=params) resp_weather.raise_for_status() weather_data_raw = resp_weather.json() weather_df = pd.DataFrame(weather_data_raw['daily']) weather_df = weather_df.rename(columns={"time": "date","temperature_2m_max": "temperature_max","temperature_2m_min": "temperature_min","precipitation_probability_mean": "rain_prob" }) weather_df['date'] = pd.to_datetime(weather_df['date']) weather_df['day'] = weather_df['date'].dt.strftime('%a') weather_mapping = {0: "Clear", 1: "Mainly Clear", 2: "Partly Cloudy", 3: "Overcast",45: "Fog", 48: "Rime Fog", 51: "Light Drizzle", 53: "Drizzle", 55: "Heavy Drizzle",56: "Light Freezing Drizzle", 57: "Freezing Drizzle", 61: "Light Rain", 63: "Rain",65: "Heavy Rain", 66: "Light Freezing Rain", 67: "Freezing Rain", 71: "Light Snow",73: "Snow", 75: "Heavy Snow", 77: "Snow Grains", 80: "Light Showers", 81: "Showers",82: "Heavy Showers", 85: "Light Snow Showers", 86: "Snow Showers", 95: "Thunderstorm",96: "Thunderstorm with Hail", 99: "Heavy Thunderstorm with Hail" } weather_df['weather'] = weather_df['weather_code'].map(weather_mapping)except requests.exceptions.RequestException as e:print(f"Failed to fetch weather data for {city_name}: {e}")returnNone# 3. Fetch Air Quality Data aqi_df =Nonetry: aqi_start_date = today - timedelta(days=7) aqi_end_date = today aqi_url ="https://air-quality-api.open-meteo.com/v1/air-quality" params = {"latitude": lat,"longitude": lon,"start_date": aqi_start_date.strftime("%Y-%m-%d"),"end_date": aqi_end_date.strftime("%Y-%m-%d"),"hourly": "pm2_5,us_aqi","timezone": "auto" } resp_aqi = requests.get(aqi_url, params=params) resp_aqi.raise_for_status() aqi_data_raw = resp_aqi.json()if'hourly'in aqi_data_raw: aqi_df = pd.DataFrame(aqi_data_raw['hourly']) aqi_df['date'] = pd.to_datetime(aqi_df['time']).dt.date aqi_df = aqi_df.groupby('date').agg( pm2_5=('pm2_5', 'median'), us_aqi=('us_aqi', 'median') ).reset_index() aqi_df['date'] = pd.to_datetime(aqi_df['date'])except requests.exceptions.RequestException as e:print(f"Failed to fetch AQI data for {city_name}: {e}")# 4. Combine and Process Data combined_df = weather_dfif aqi_df isnotNone: combined_df = pd.merge(combined_df, aqi_df, on="date", how="left") combined_df['City'] = city_name combined_df['lat'] = lat combined_df['lon'] = lon combined_df['forecast_flag'] = combined_df['date'].apply(lambda x: 'forecast'if x.date() > today else'current')def get_aqi_status(us_aqi):if pd.isna(us_aqi):return"N/A"if us_aqi <=50:return"Good"if us_aqi <=100:return"Moderate"if us_aqi <=150:return"Unhealthy for Sensitive Groups"if us_aqi <=200:return"Unhealthy"if us_aqi <=300:return"Very Unhealthy"return"Hazardous"if'us_aqi'in combined_df.columns: combined_df['us_aqi_status'] = combined_df['us_aqi'].apply(get_aqi_status)else: combined_df['us_aqi_status'] ="N/A" combined_df['pm2_5'] =None combined_df['us_aqi'] =Nonereturn combined_df```## 3. Create a streamlit app to display the plot and tablea streamlit app `weather_app.py` to display the weather with plotly and greate table```{python}#| echo: true#| code-fold: trueimport pandas as pdimport streamlit as stfrom great_tables import GT, loc, styleimport plotly.express as pxst.set_page_config(layout="wide")# Load the data@st.cache_datadef load_data():return pd.read_csv("weather_data.csv")weather_df = load_data()# City selectioncities = weather_df["City"].unique()selected_city = st.selectbox("Select a city", cities)# Filter data for the selected citycity_df = weather_df[weather_df["City"] == selected_city].reset_index(drop=True)@st.cache_datadef convert_df_to_csv(df):# IMPORTANT: Cache the conversion to prevent computation on every rerunreturn df.to_csv(index=False).encode("utf-8")csv = convert_df_to_csv(city_df)st.download_button( label="Download Weather Data (CSV)", data=csv, file_name=f"{selected_city}_weather_data.csv", mime="text/csv",)# Display the Plotly chartst.header("Temperature Trend")fig = px.line(city_df, x="date", y=["temperature_max", "temperature_min"], labels={"value": "Temperature (°C)", "variable": "Temperature Type"}, title="Max and Min Daily Temperatures")st.plotly_chart(fig, use_container_width=True)# Display the Great Tablest.header(f"Weather Forecast for {selected_city}")gt = GT(city_df)gt = gt.tab_header( title=f"{selected_city}", subtitle=f"Weather from {pd.to_datetime(city_df['date'].min()).strftime('%B %d')} to {pd.to_datetime(city_df['date'].max()).strftime('%B %d, %Y')}")# Color AQI statusaqi_colors = {"Good": "#90EE90","Moderate": "#FFFF00","Unhealthy for Sensitive Groups": "#FFA500","Unhealthy": "#FF0000","Very Unhealthy": "#800080","Hazardous": "#808080"}for status, color in aqi_colors.items(): gt = gt.tab_style( style=style.fill(color=color), locations=loc.body( columns="us_aqi_status", rows=lambda df: df["us_aqi_status"] == status ) )gt = gt.data_color( columns=["rain_prob"], domain=[50, 100], palette=["#ffcdd2", "#f44336"], na_color="#FFFFFF00")gt = gt.fmt_number(columns=["temperature_max", "temperature_min", "pm2_5", "us_aqi"], decimals=1)gt = gt.fmt_percent(columns=["rain_prob"], scale_values=False, decimals=0)gt = gt.cols_label( date="Date", day="Day", temperature_max="Max Temp (°C)", temperature_min="Min Temp (°C)", weather="Weather", rain_prob="Rain Probability", pm2_5="PM2.5", us_aqi="US AQI", us_aqi_status="AQI Status")st.html(gt._repr_html_())```## 4. Run the streamlit app using github actiongithub action to run the streamlit app: `.github/workflows/schedule-email.yml`. it run every day 6:00PM Beijing time (22:00 UTC).And it will also run when a new push to the main branch.``` yamlname: Refresh weather dataon:push:branches:-mainschedule:-cron:'0 22 * * *' # 6:00 AM Beijing time is 22:00 UTCjobs:refresh-data:runs-on: ubuntu-latestpermissions:contents: writesteps:-name: Check out repositoryuses: actions/checkout@v4-name: Set up Pythonuses: actions/setup-python@v5with:python-version-file:"pyproject.toml"-name: Install uvuses: astral-sh/setup-uv@v6-name: Install the projectrun: uv sync --locked --all-extras --dev-name: Run data download scriptrun: uv run download_data.py-name: Commit and push if it changed run: |- git config user.name "Automated Publisher" git config user.email "actions@users.noreply.github.com" git add -A timestamp=$(date -u) git commit -m "Latest data: ${timestamp}" || exit 0 git push```
