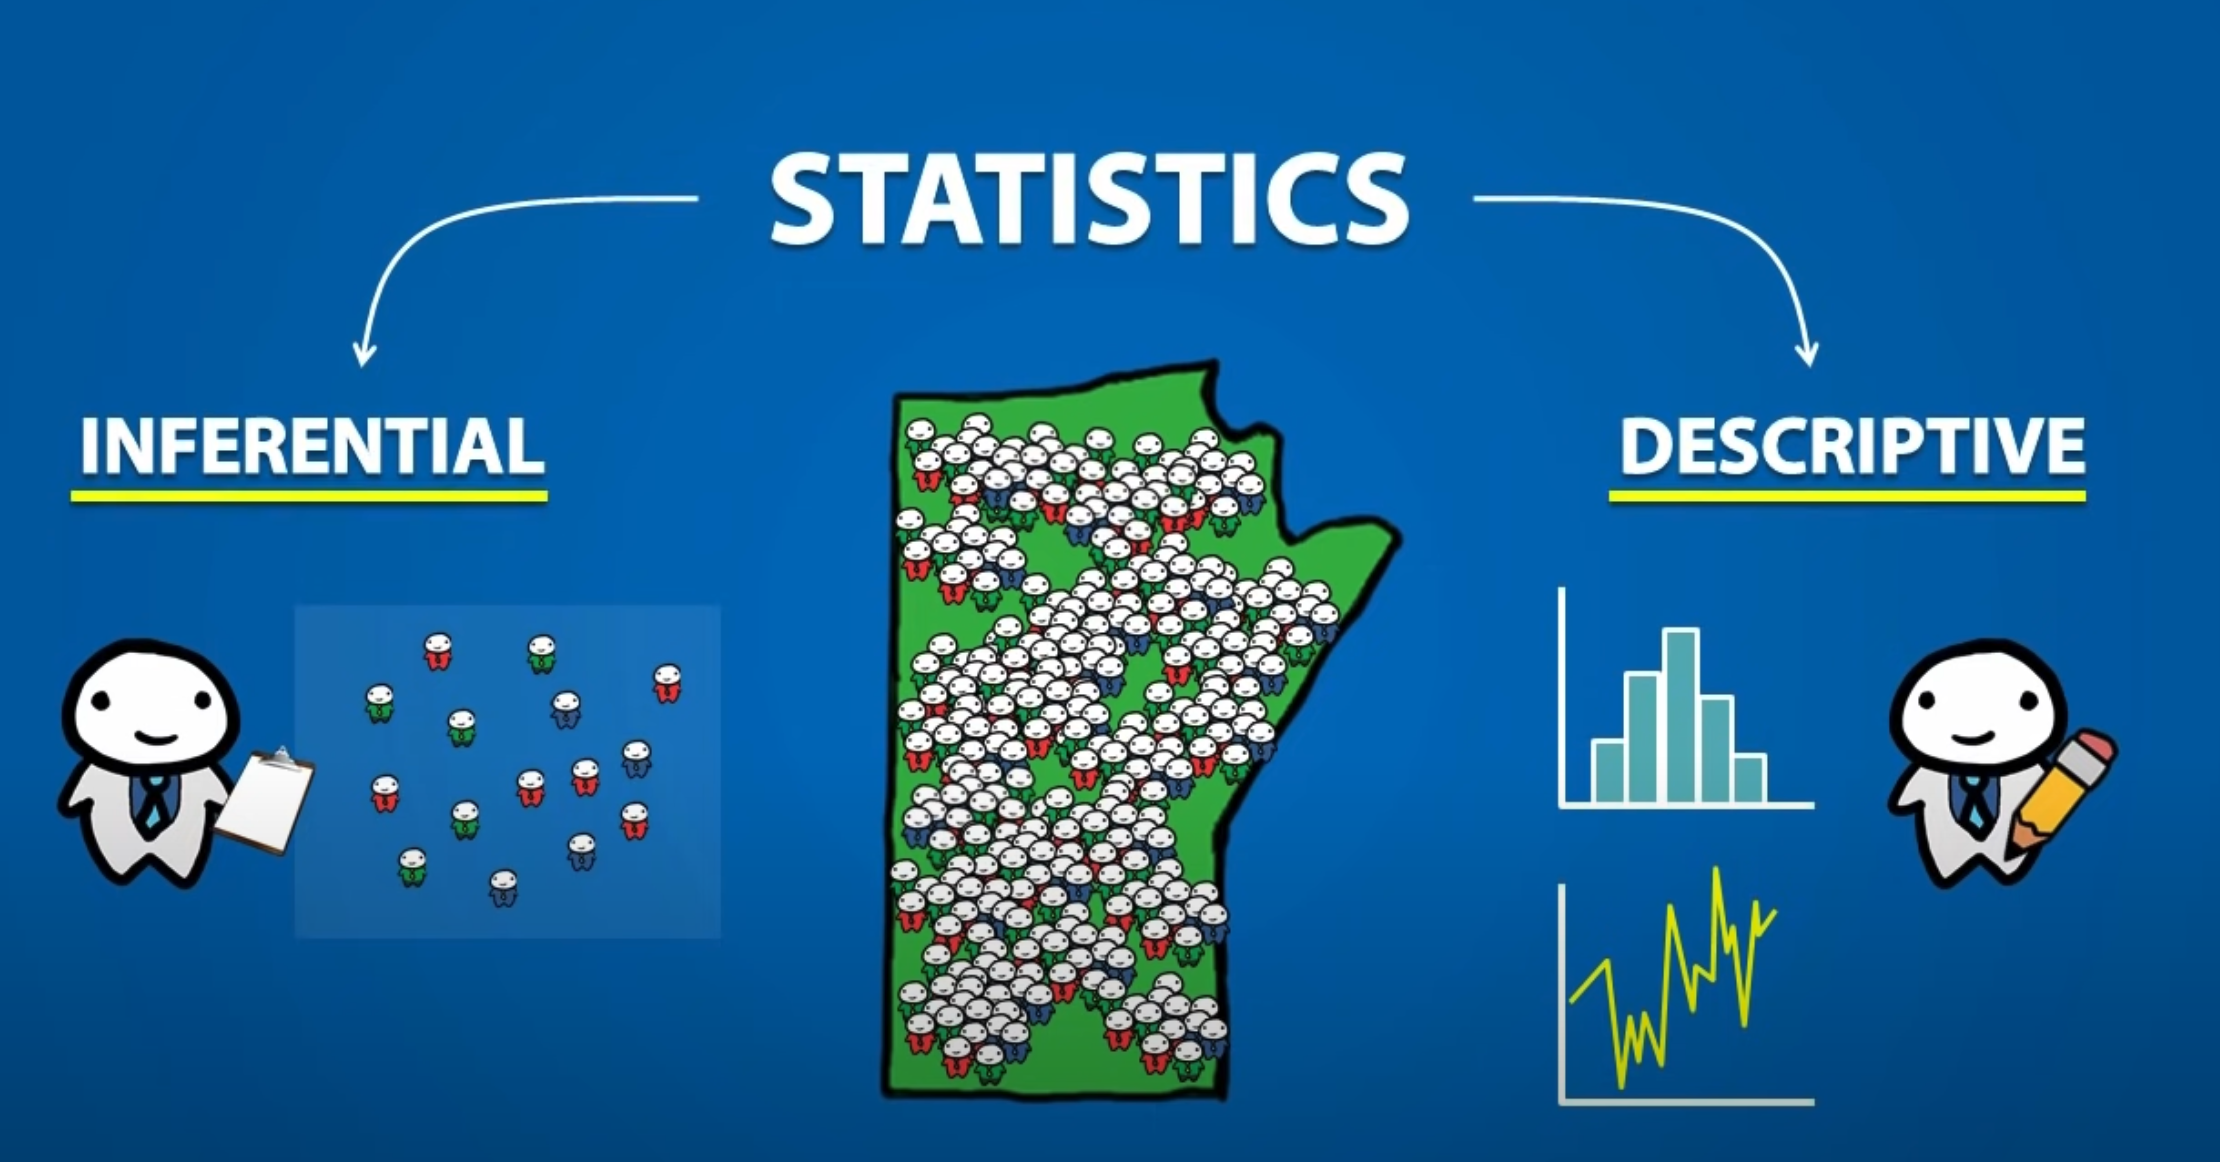
Statistics
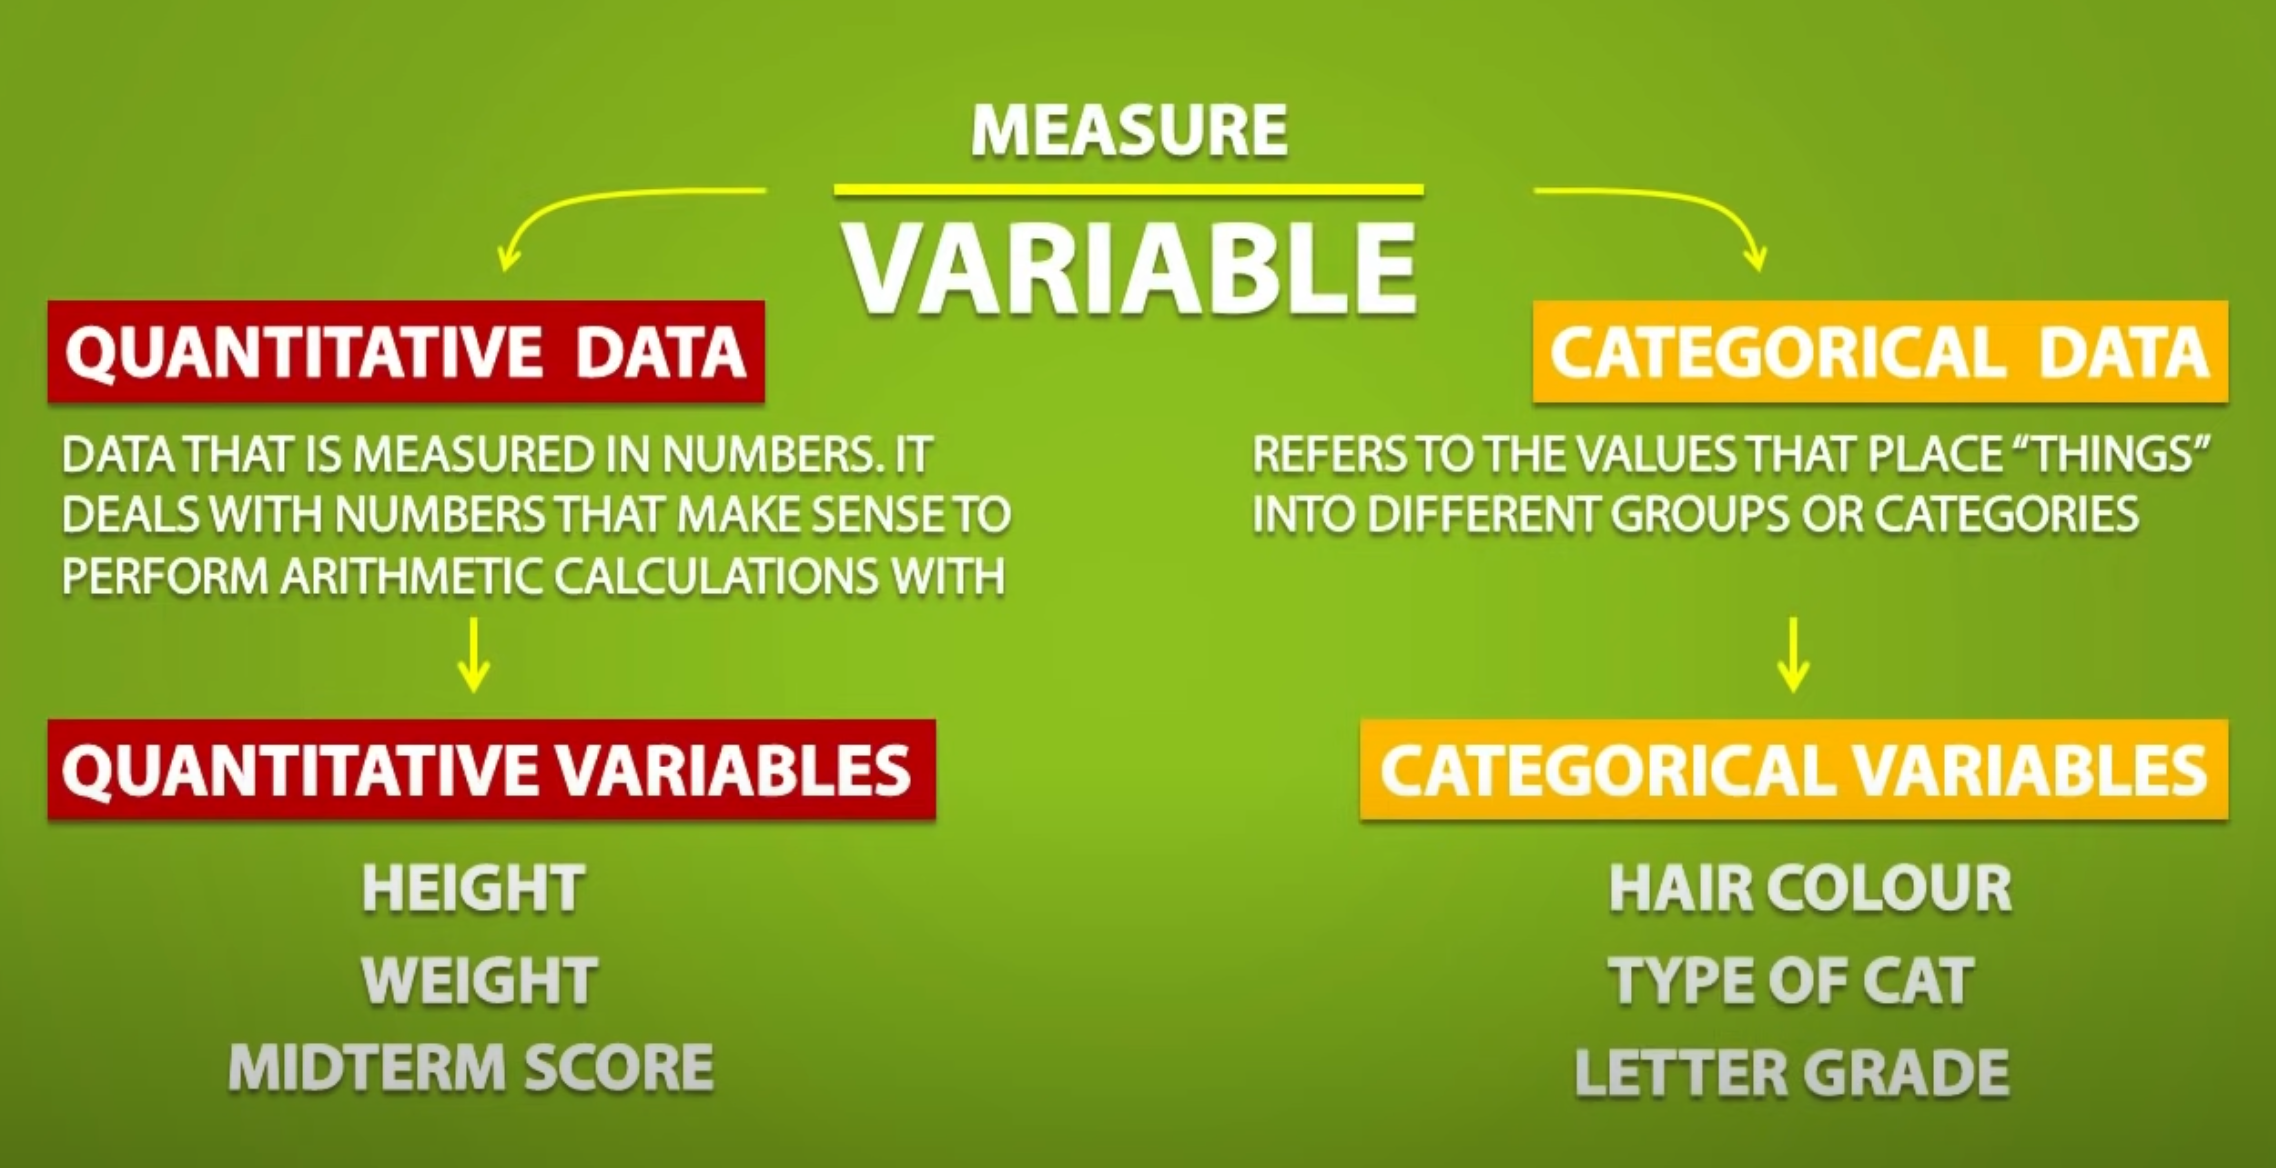
Variable
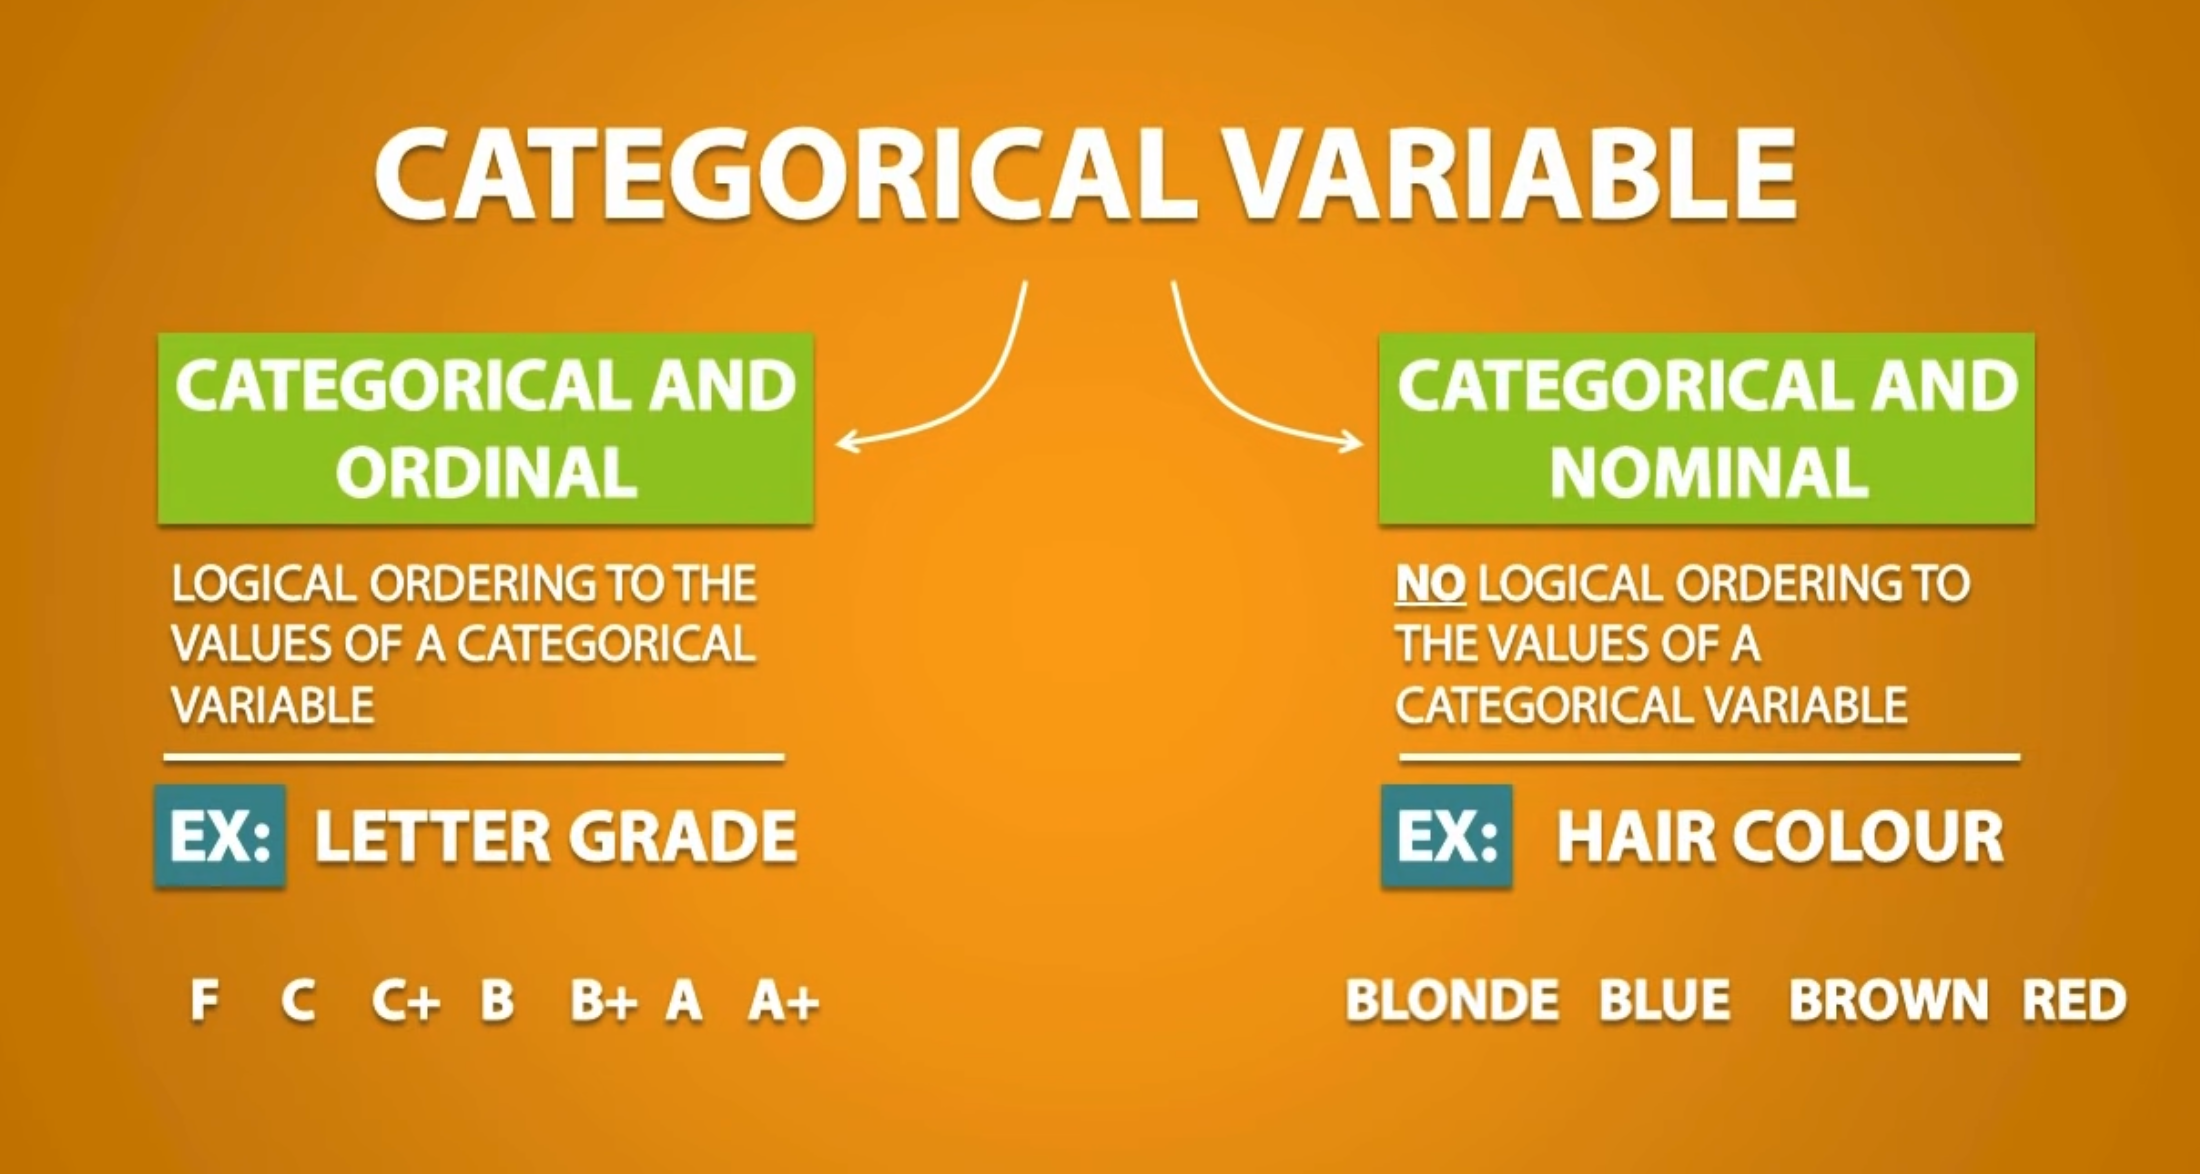
Categorical variable
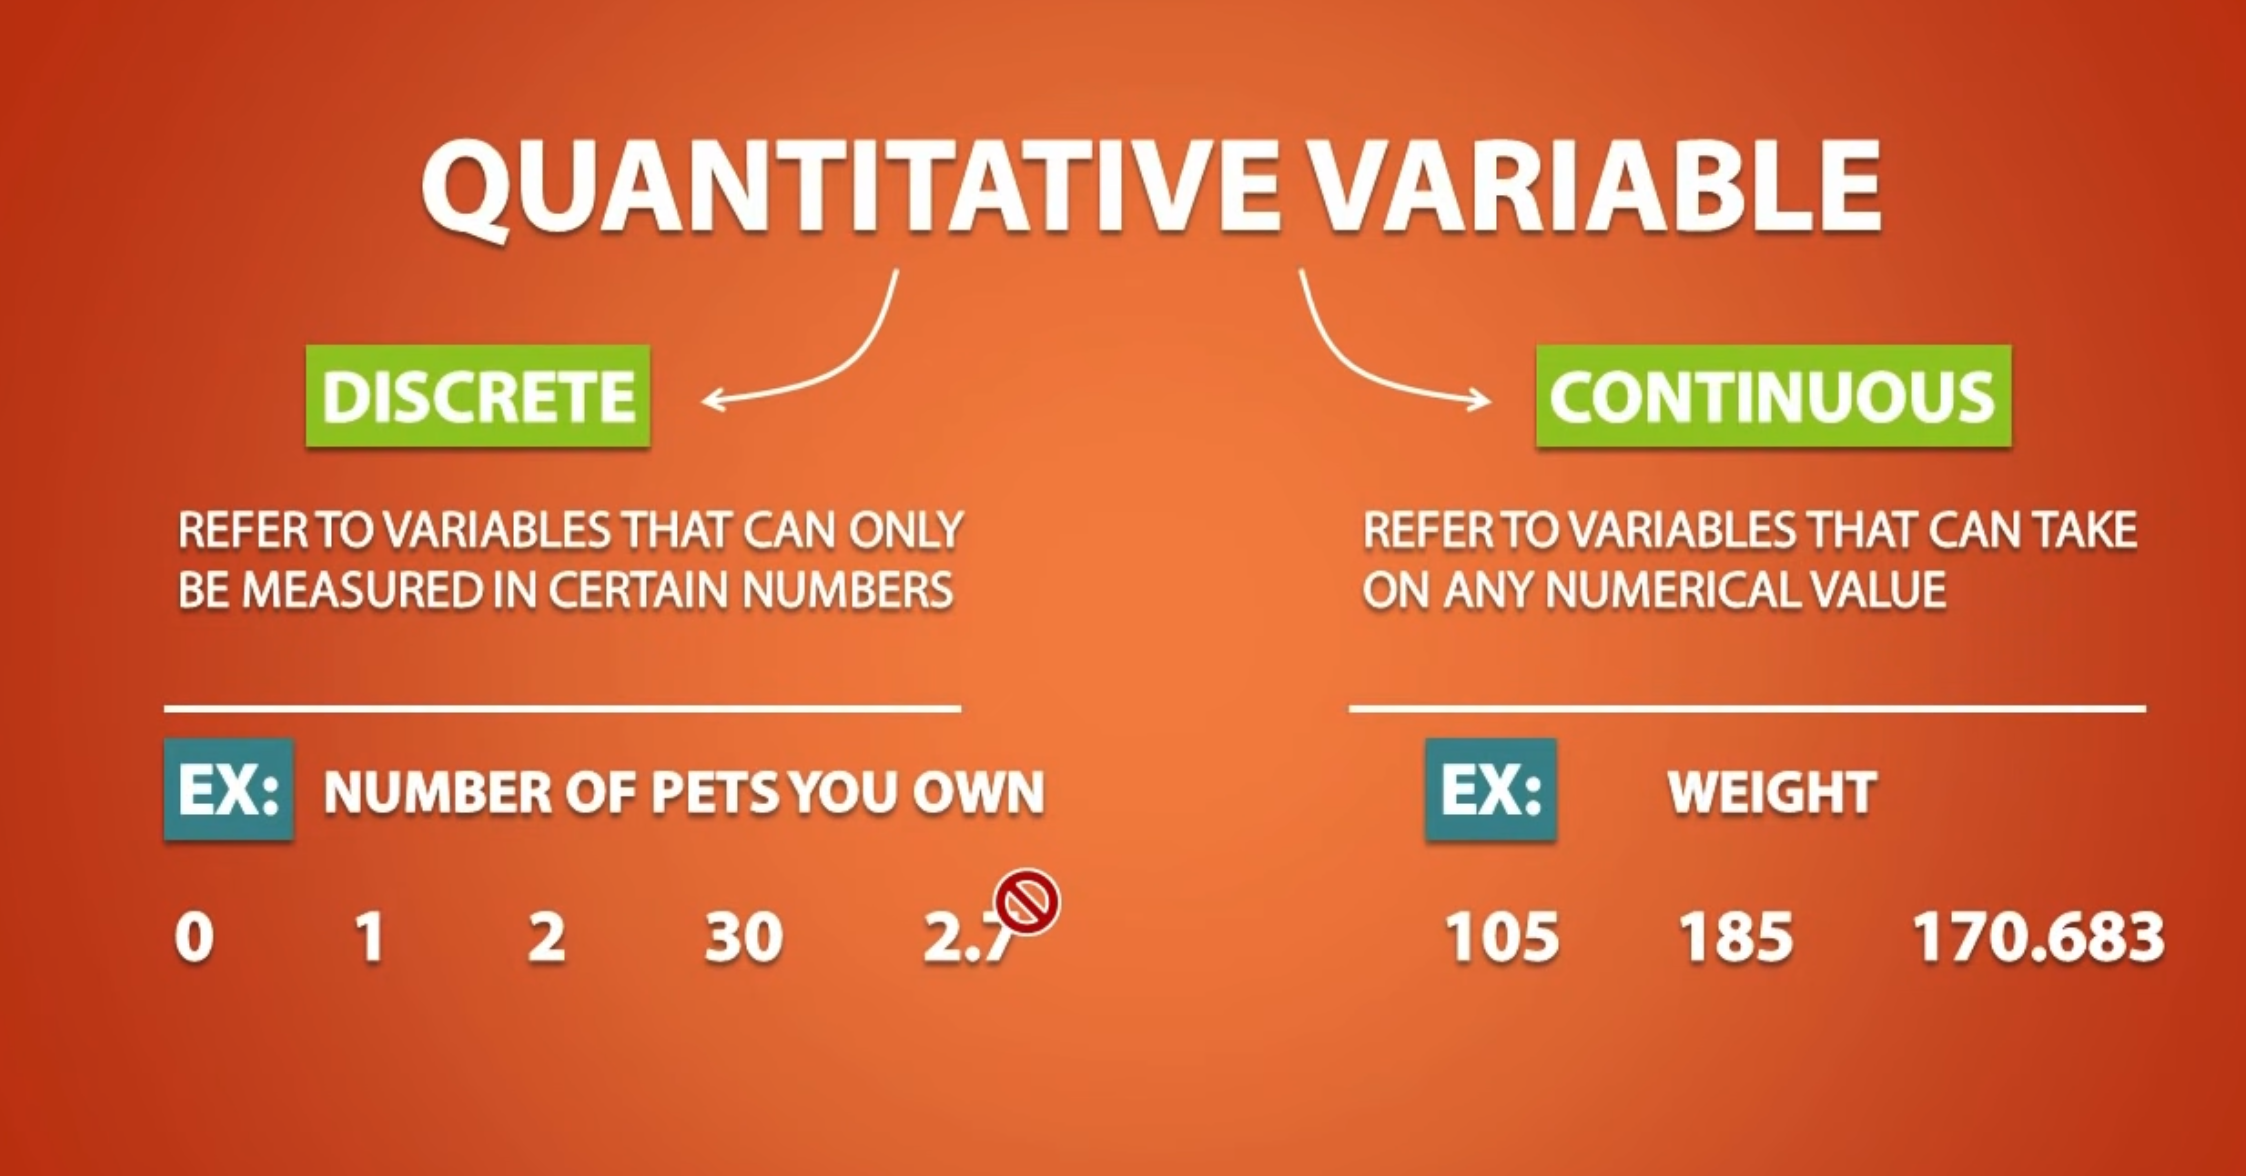
Quantitative variable
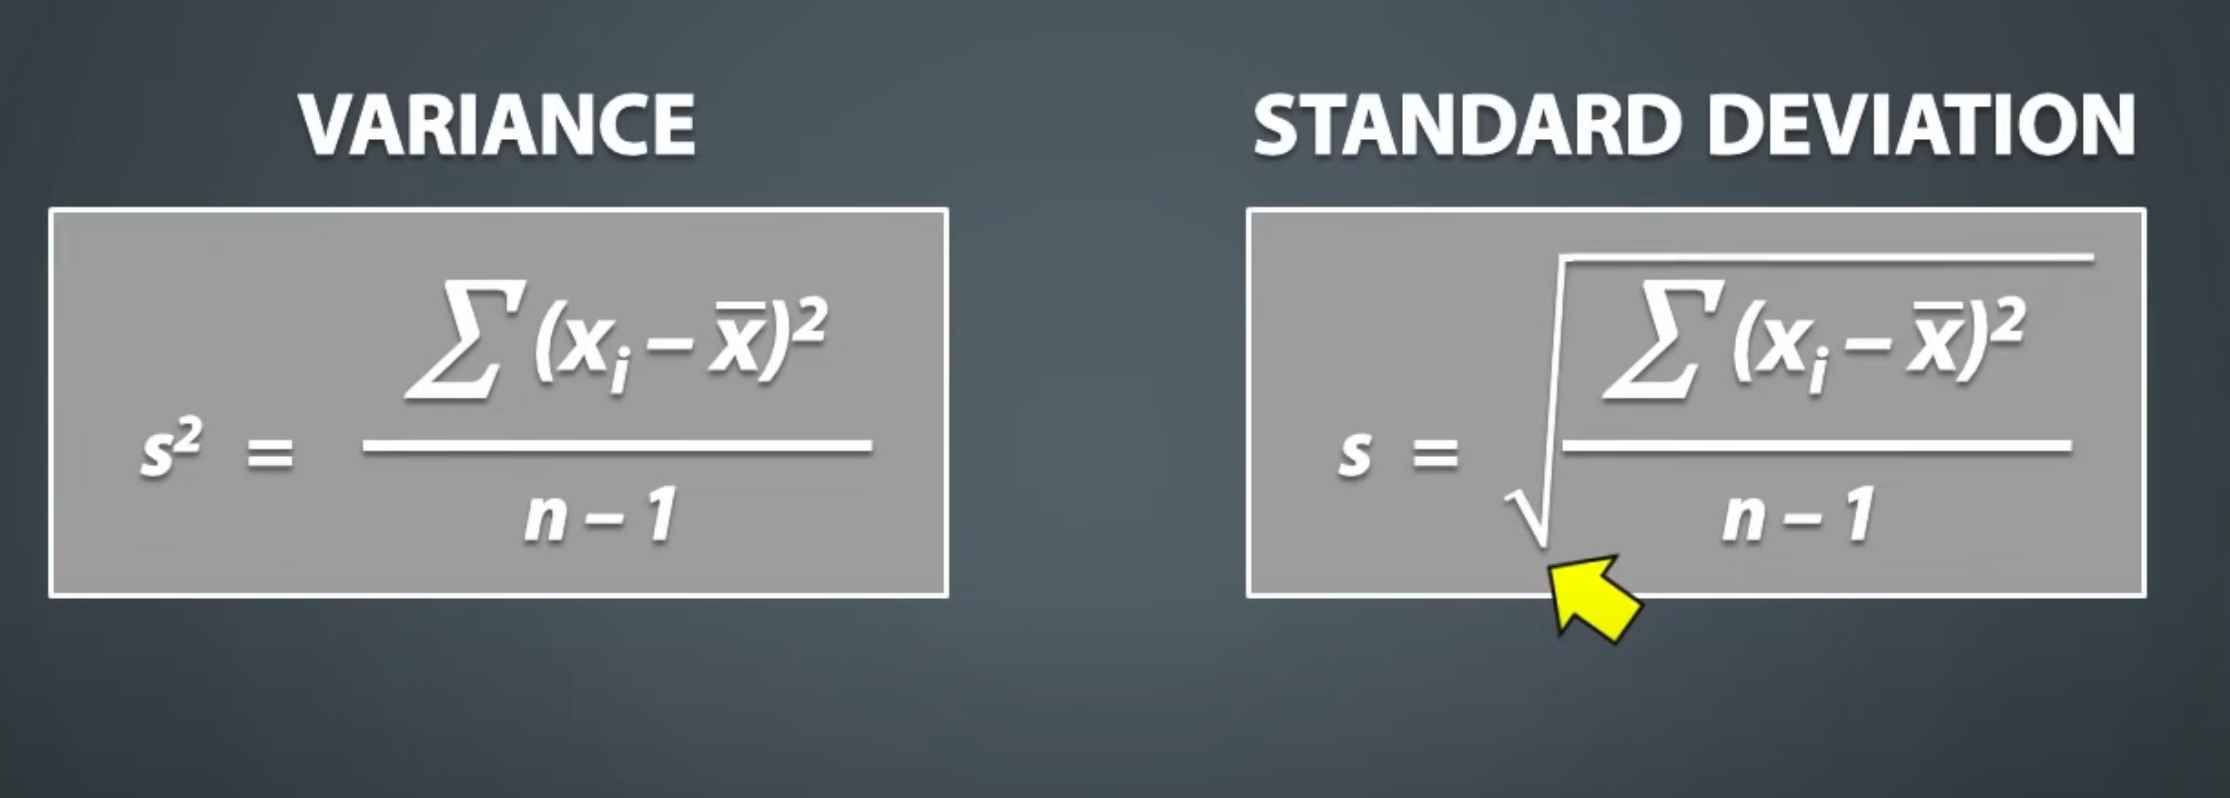
Variance vs Standard deviation
Statistics
Spread: Variance, Standard Deviation, and the Interquartile Range
Covariance and Correlation
When analyzing data, it’s often useful to be able to investigate the rela- tionship between two numeric variables to assess trends. For example, you might expect height and weight observations to have a noticeable positive relationship—taller people tend to weigh more. Conversely, you might imag- ine that handspan and length of hair would have less of an association. One of the simplest and most common ways such associations are quantified and compared is through the idea of correlation, for which you need the covariance. The covariance expresses how much two numeric variables “change together” and the nature of that relationship,
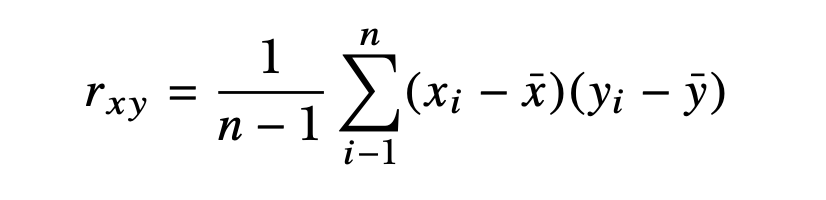
Correlation,Pearson’s product-moment correlation coefficient
Pearson’s sample correlation coef- ficient ρxy is computed by dividing the sample covariance by the product of the standard deviation of each data set

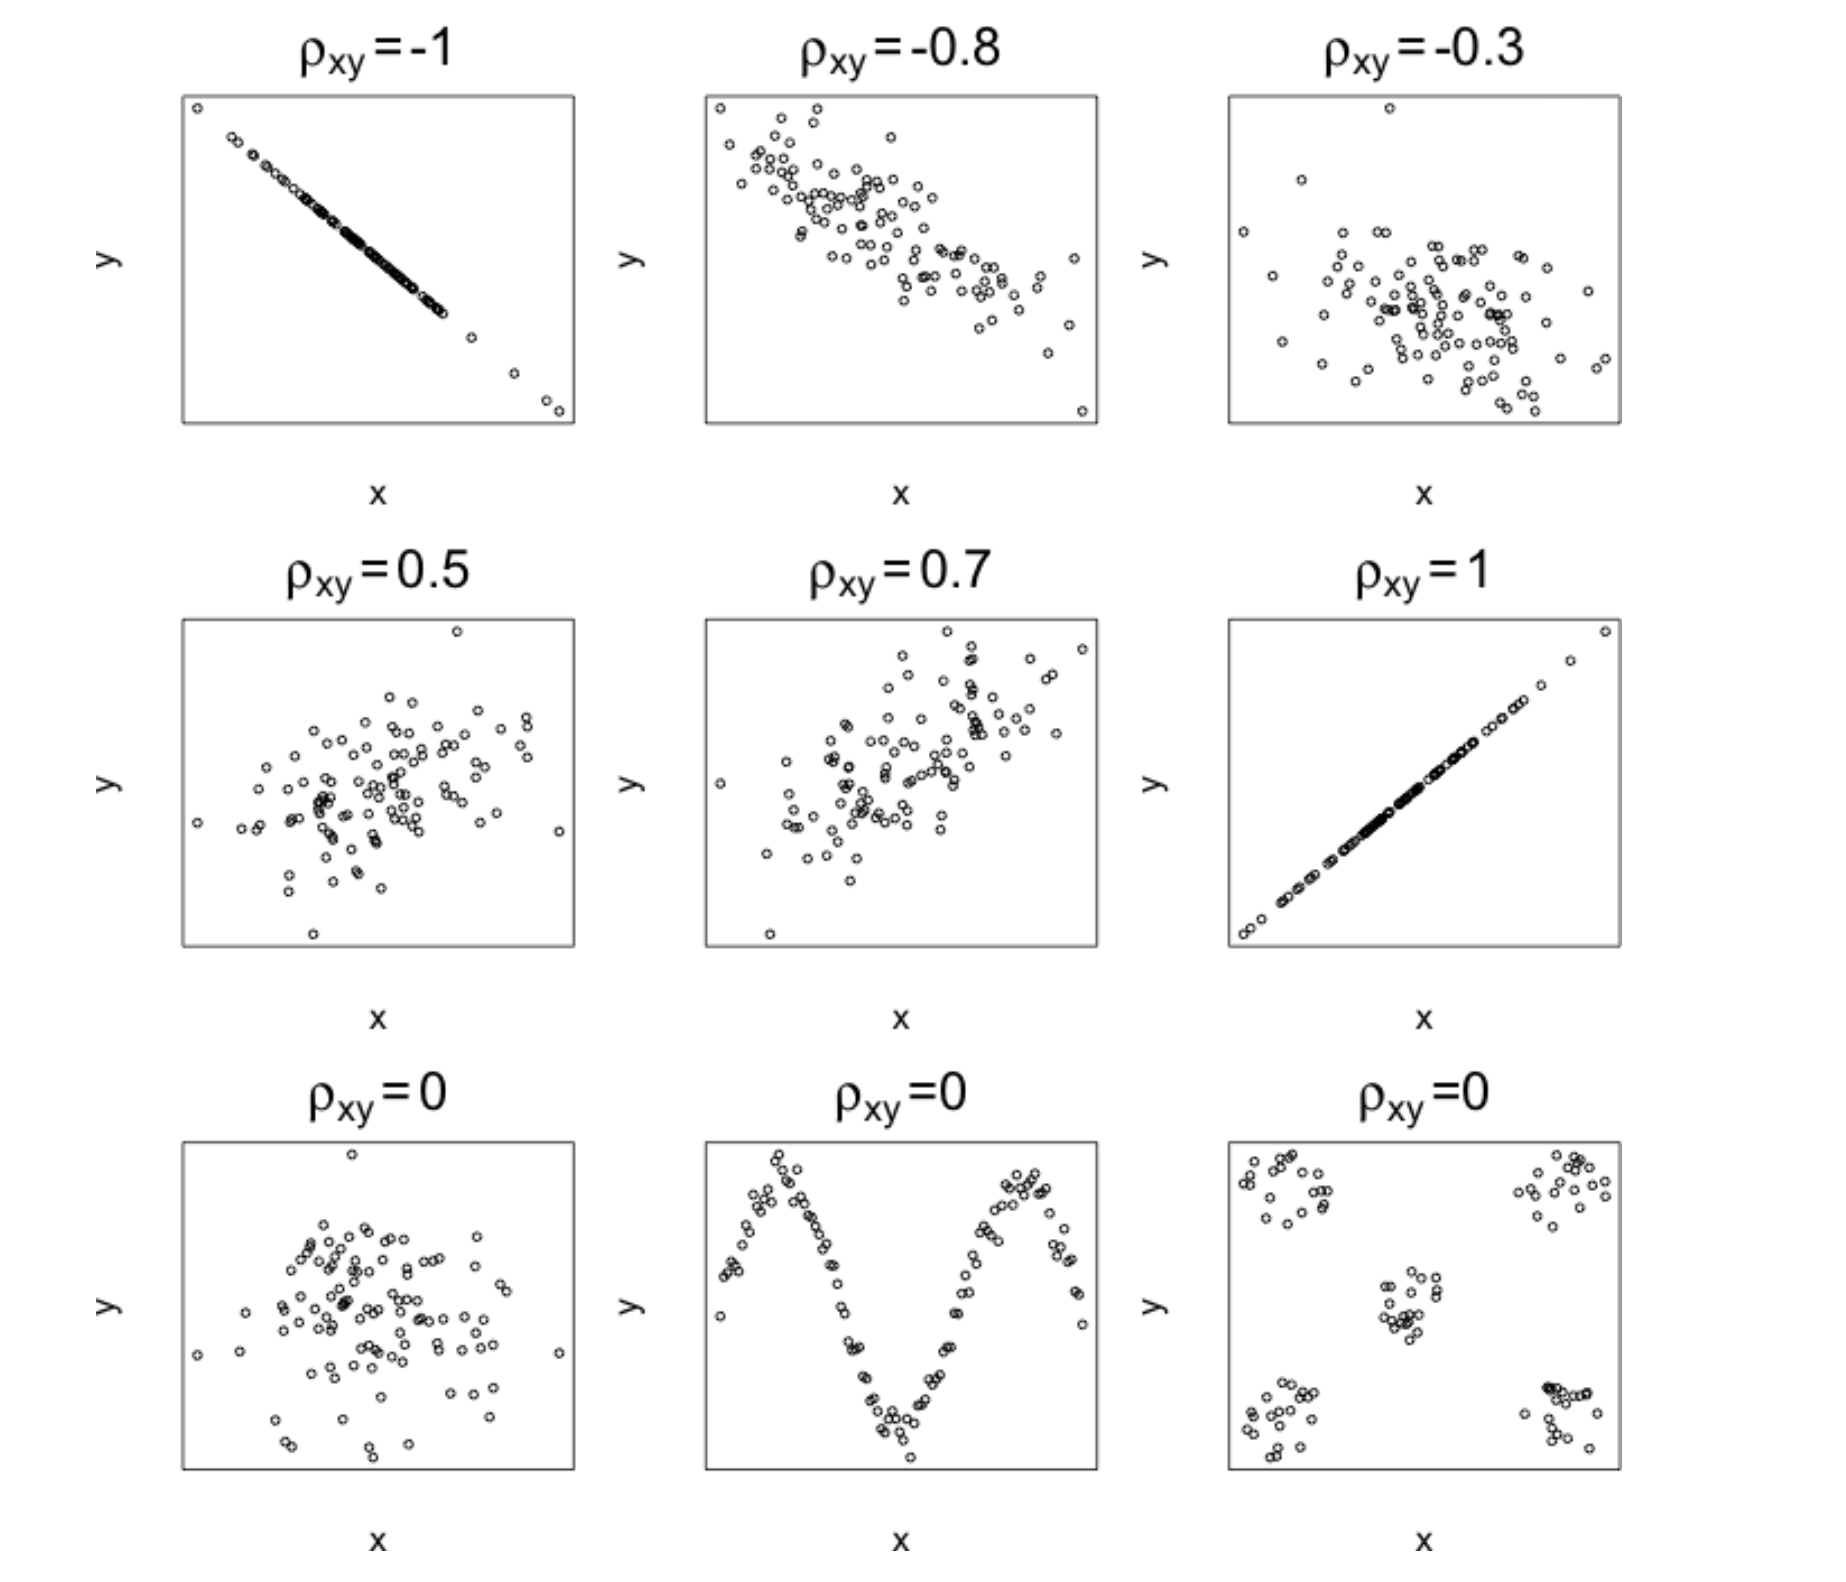
Some Correlation Example:
Reference
https://www.youtube.com/watch?v=MXaJ7sa7q-8
Code
sessionInfo()
R version 4.4.1 (2024-06-14)
Platform: aarch64-apple-darwin20
Running under: macOS 15.3.1

Matrix products: default
BLAS:   /Library/Frameworks/R.framework/Versions/4.4-arm64/Resources/lib/libRblas.0.dylib
LAPACK: /Library/Frameworks/R.framework/Versions/4.4-arm64/Resources/lib/libRlapack.dylib;  LAPACK version 3.12.0

locale:
[1] en_US.UTF-8/en_US.UTF-8/en_US.UTF-8/C/en_US.UTF-8/en_US.UTF-8

time zone: Asia/Shanghai
tzcode source: internal

attached base packages:
[1] stats     graphics  grDevices utils     datasets  methods   base

loaded via a namespace (and not attached):
 [1] htmlwidgets_1.6.4 compiler_4.4.1    fastmap_1.2.0     cli_3.6.4
 [5] tools_4.4.1       htmltools_0.5.8.1 yaml_2.3.10       rmarkdown_2.29
 [9] knitr_1.49        jsonlite_1.9.1    xfun_0.51         digest_0.6.37
[13] rlang_1.1.5       evaluate_1.0.3
Back to top