---
title: "Shiny in quarto doc"
author: "Tony Duan"
execute:
warning: false
error: false
eval: false
format:
html:
toc: true
toc-location: right
code-fold: show
code-tools: true
number-sections: true
code-block-bg: true
code-block-border-left: "#31BAE9"
---
# step 1 add in header
```yaml
---

format: html server: shiny

---
```
# step 2 make shinyapp
```{r}
#| context: setup
#| message: false
#| warning: false
library(bslib)
library(ggplot2)
```
## server
```{r}
#| context: server
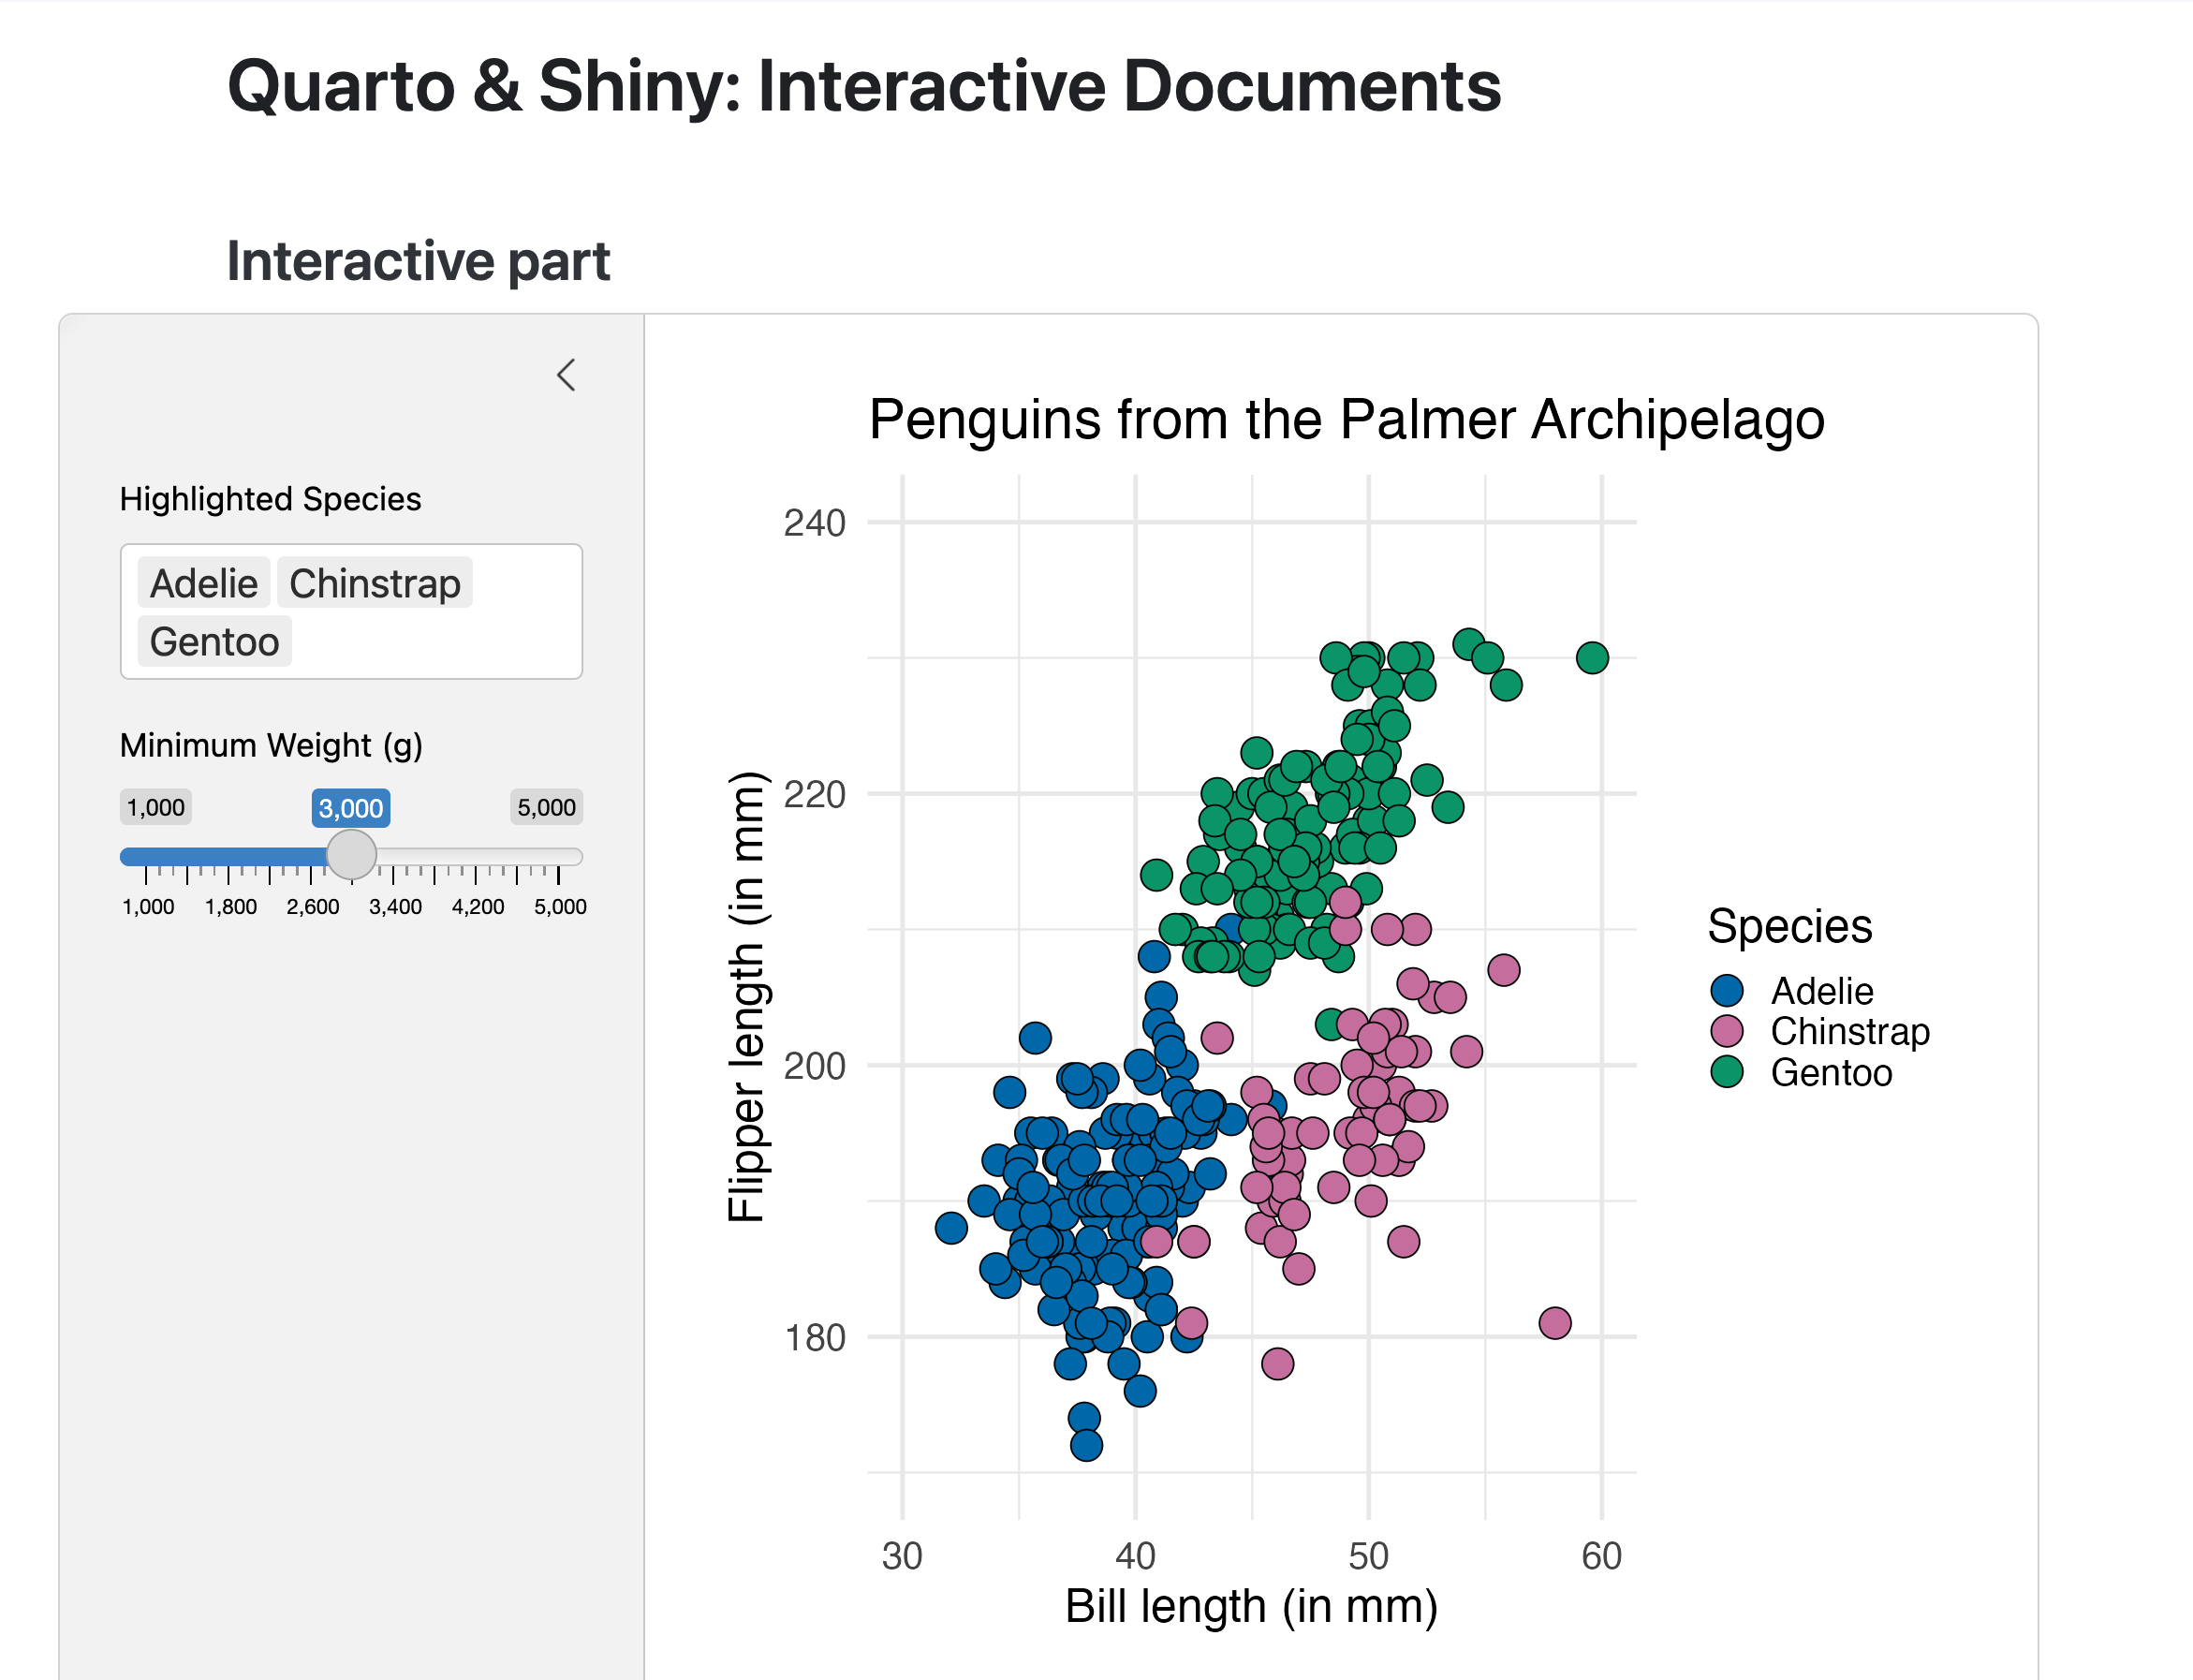
output$output_plot <- shiny::renderPlot({
  palmerpenguins::penguins |>
    dplyr::filter(
      species %in% input$select_species,
      body_mass_g >= input$slider_weight
    ) |>
    ggplot(
      aes(
        x = bill_length_mm,
        y = flipper_length_mm,
        fill = species
      )
    ) +
    geom_point(
      shape = 21,
      size = 6,
      col = 'black'
    ) +
    labs(
      x = 'Bill length (in mm)',
      y = 'Flipper length (in mm)',
      fill = 'Species',
      title = 'Penguins from the Palmer Archipelago'
    ) +
    theme_minimal(
      base_size = 20,
      base_family = 'Source Sans Pro'
    ) +
    scale_fill_manual(
      values = c(
        Adelie = '#0072B2',
        Gentoo = '#009E73',
        Chinstrap = '#CC79A7'
      ),
    ) +
    coord_cartesian(
      xlim = c(30, 60),
      ylim = c(170, 240)
    )
})
```
## ui
```{r}
layout_sidebar(
  height = 600,
  sidebar =  sidebar(
    shiny::selectizeInput(
      'select_species',
      'Highlighted Species',
      choices = c('Adelie', 'Chinstrap', 'Gentoo'),
      selected = c('Adelie', 'Chinstrap', 'Gentoo'),
      multiple = TRUE
    ),
    shiny::sliderInput(
      'slider_weight',
      'Minimum Weight (g)',
      min = 1000,
      max = 5000,
      value = 3000
    )
  ),
  shiny::plotOutput('output_plot')
)
```